coverage
what disco actually looks at.
Every cloud has a service that promises to list your resources in one place — aws resource explorer, azure resource graph, google cloud asset inventory. They are convenient, and they are incomplete, because they carry whatever each provider chose to publish to a shared index.
disco asks each service directly instead, in that service's own terms. That is more work to build — a scanner per service, rather than one query against a shared index — and it is why the things below show up at all.
It is not more work to wait for. One aws account, every region it has enabled, under ten thousand resources: five to six minutes. A single region takes about fifteen seconds.
what a shared index leaves out
- kms grants — who was allowed to use a key, separately from the key policy, which is where the surprising answers live
- efs mount targets — the thing that actually attaches a file system to a network, and the reason one is reachable
- cloudformation-managed resources — so you can tell what a stack owns from what somebody created by hand next to it
- iam identity center assignments — who has access to which account, which is not visible from inside any one account
- entra id identities — the azure directory side of who can reach a subscription
- vpc service controls perimeters — the google cloud boundary that decides whether data can leave at all
Six is a sample. The scanner is open source, so what it reads in each cloud is published in full rather than summarized here.
Reading all of that needs access to your cloud. You grant a role, never a key, and you revoke it yourself — how that works.
how much
the edges
listing what exists is the easy half. the work is what connects to what.
After the scan, a second pass works out how the things it found relate to each other, and files each connection under one of 11 kinds. Because each one is labeled, you can ask a specific question — what does this role let someone reach — instead of getting back everything that happens to be nearby. One graph holds all three clouds, and every edge is kept from every scan, so you can also ask when it appeared.
| kind | what it means |
|---|---|
contains | one thing that owns another — a deployment stack and everything it created, a scaling group and its machines |
uses | one thing that depends on another to work — a function reading an encryption key, a permission granted over that key |
attached-to | something that only exists as part of another thing — a flow log recording traffic on a network, an authorizer belonging to one api |
routes-to | traffic sent onward — an api endpoint reaching the thing that answers it, a private link reaching a load balancer |
assumes | something that takes on a role in order to act, and so inherits everything that role can do |
peer | two things joined as equals — two networks connected to each other, a database and its standby |
bounded-by | a ceiling on what a role or user is allowed to do, whatever else has been granted to them |
cross-account-trust | an aws account that has agreed to let someone outside it in — the other side may not be an account you own |
cross-sub-rbac | someone granted access in one azure subscription to something in a different one |
cross-project-iam | access in one google cloud project granted to an identity that belongs to another |
org-iam | access granted high up in google cloud, at the organization or folder, so it reaches everything underneath |
service limits
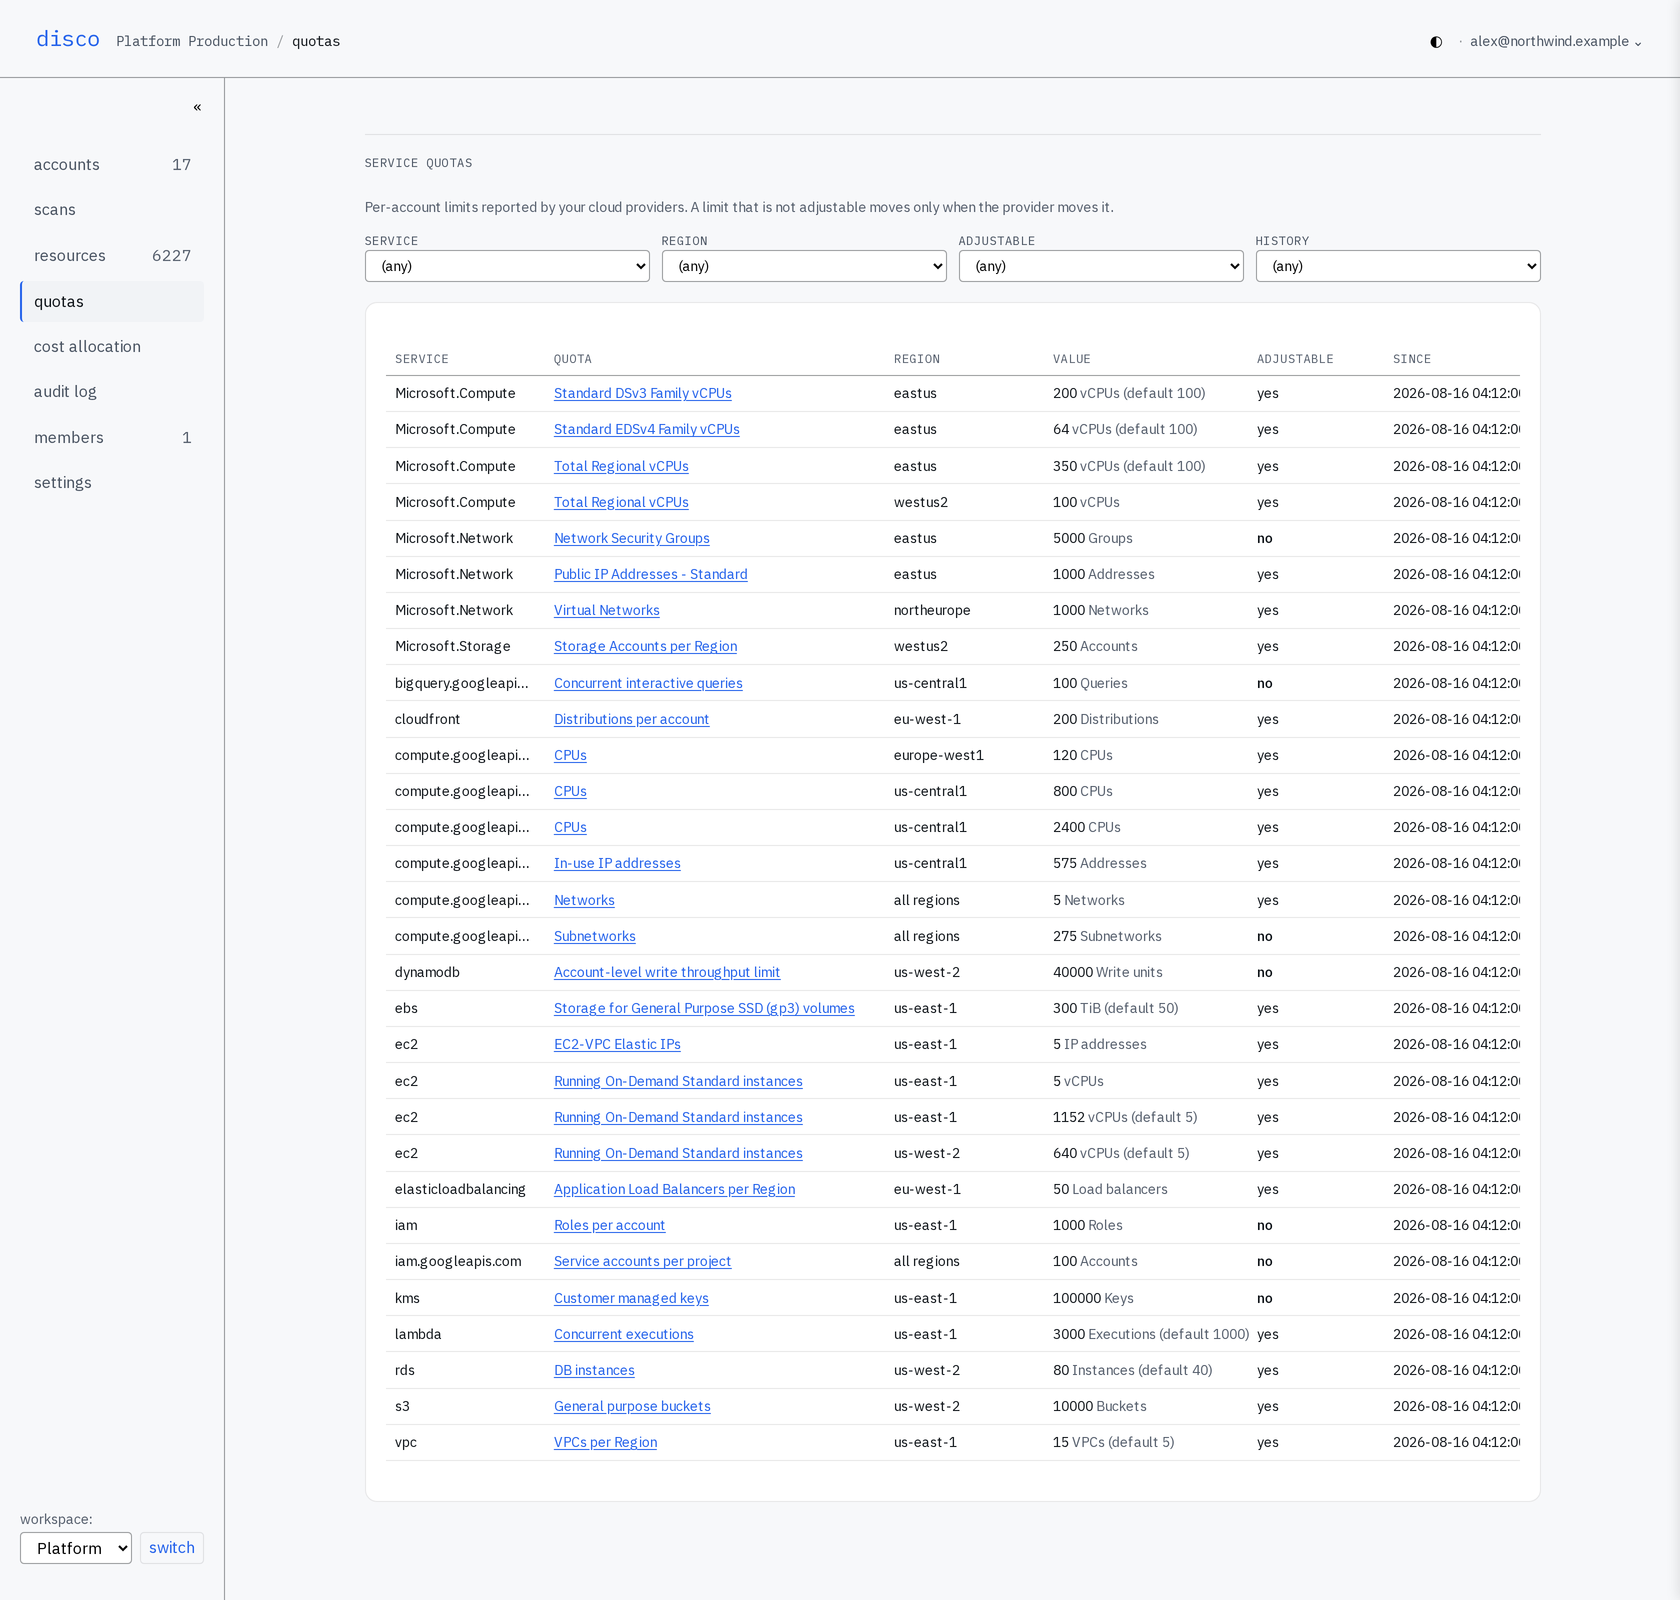
Limits are recorded alongside everything else, so a limit that moves leaves a trail. What differs between the clouds is when they are collected and whether the provider tells anyone what the starting value was.
| provider | collected | starting value |
|---|---|---|
| aws | on request, per scan | published, so a raised limit is visible as a difference |
| azure | every scan | published, so a raised limit is visible as a difference |
| google cloud | every scan | not published by the provider — the change history carries the signal instead |
what is missing
No inventory is ever finished, because the providers keep shipping. The useful question is not whether a tool covers everything — nothing does — but whether it knows what it is missing.
disco measures that. It reads each provider's own current list of resource types and compares it against what it can actually collect, and every difference between the two is a gap somebody can see and close. That comparison is why the numbers above move, and it is the reason they are printed as approximate rather than as a fixed promise.
The part of disco that does the reading is open source, so the list of what it covers is not something you have to take on trust from a marketing page: it is published in full.